Over the last couple of years I have been using a power meter to help with my own cycling training and also help some of my clients. One of the things I like about using the power meter is that the numbers take out all the variability of heart rate and the environment. I collect data from various races and training events to help plan the amount of effort required for training and competing in future events. One such event is a team time trial.
As in a solo time trial, a team time trial is a race against the clock. You and your teammate(s) take turns on the front to lead the team. The cyclist on the front is producing the most power at any given time. The team members following behind benefit from the draft, or reduction in air resistance resulting from following someone else closely.
One of the key parameters to a successful team event is making sure that when each rider goes to the front they know how much effort (power) they need to produce and for how long. Going too fast runs the risk of losing some of the team. In addition, you may run the risk of having run up too much of an oxygen debt by pushing too hard or for too long. If you run up too much debt, then there is insufficient time to recover while someone else is on the front before it is your turn again. If you have observed any team races on the road or track it is apparent that changeovers can take place within thirty seconds or up to a few minutes depending upon the nature of the event.
You may have noticed in your own riding that it is possible to ride faster for a shorter time (and then recover) than it is possible to ride at a sustained speed for a longer period. So, as a cyclist, it is useful to know how fast you can ride over a sustained period of thirty minutes or an hour. While it is possible to assess this using heart rate, speed, or perceived exertion, this is where a power measurement device really helps.
The Role of Power Measurement
 Power measurement avoids much of the variability of heart rate, perceived exertions, and changes in the course and weather. Heart rate is quite slow to respond and so using it to monitor changes over short durations is not very helpful.
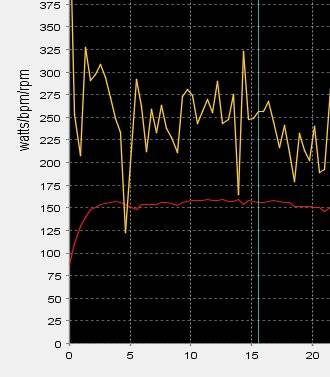
This first chart shows the power (yellow line) and heart rate (red line) at the start of an event. This measurement was taken using PowerAgent software. Notice that it takes a few minutes for the heart rate to catch up with the amount of effort. Also, in spite of the variations in power output, the heart rate varies little. The heart rate typically lags behind what is happening.
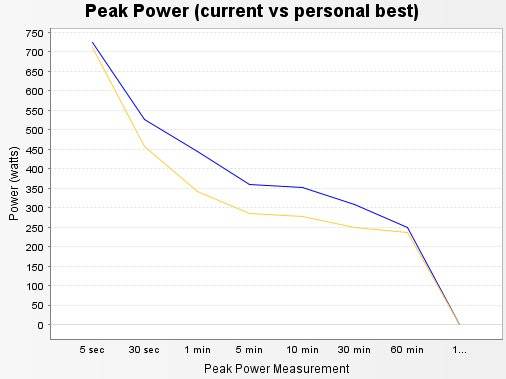
Collection of data over several events enabled me to plot out the next chart. This shows the best figures of power output for various durations over several events. This was plotted again using Poweragent, but other software is also available.

So this rider can generate the following power outputs for different durations:
- 5 minutes = 284 watts
- 2 minutes = 311 watts
- 1 minutes = 341 watts
A thirty minute sustained effort would be 247 watts and one hour would be 238 watts.
The one-hour figure is an important metric. It is often referred to as functional threshold power (FTP). This is the maximum average power you could sustain over a period of one hour. Typically this is the highest power that can be generated aerobically. Any power above this requires anaerobic use of glycogen and if undertaken long enough will start to generate that familiar burning feeling and fade as excess acidosis occurs in the muscles.
Information on FTP is useful as it could be used to plan out a team event. If changeovers take place such that this rider is on the front, then the team knows they could ride for two minutes at 311 watts before changing over. If this were a two-rider event, such as a two-up team time trial, the partners would have two minutes to benefit from each other’s draft before going on the front again. In theory the riders, assuming similar ability, could also change every minute at 341 watts with a shorter recovery.
This raises the next question. Would two minutes be sufficient to recover? The effort produced in this short interval is above the threshold and so recovery will be essential to disperse lactic acid in the muscles. In order to solve this part of the planning, some estimate of the recovery effort is needed. The effort while drafting needs to be well below threshold to facilitate recovery. In the example this would need to be less than 238 watts.
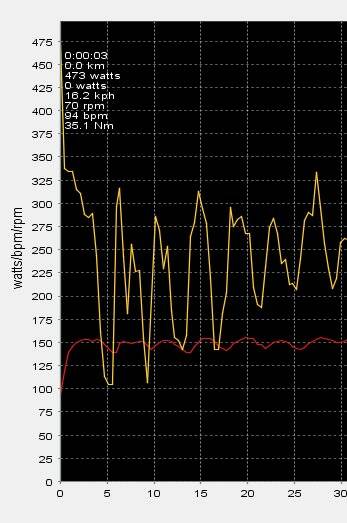
 The third chart now shows the power output and heart rate for one rider in a team of two who are changing every two minutes. The yellow line shows the power output.
The increases and decreases in power can be observed as the riders change. The reduction in power by cycling in the draft is between 25% and 50%. The rider is attempting to maintain 300 watts at the front. The red line shows the heart rate. Note the slight reduction during the drafting periods. As the cyclist uses less draft (approximately 25%) at the twenty-minute mark, the variations in heart rate also become less, indicating less recovery is taking place. This particular rider has a one-hour FTP of 233 watts.
It would appear from the graph that while the power is fluctuating above and below threshold, the average power produced by the cyclist remains about his or her FTP level. It is the succession of the riders producing higher peak powers over the shorter intervals that enables the team to ride quickly.
One might hypothesise for initial planning purposes that the amount of energy expended above threshold should be about the same as the amount of energy recovered below threshold. If the pair of riders were to attempt to ride at a shorter interval, for example one minute at 341 watts with an FTP of 233 watts, the additional energy expenditure is 108 watts over one minute compared to the FTP level. In order to recover sufficiently, using our hypothesis, the recovery level needs to balance that out, which is a level of 125 watts for the minute. The graph of the two real riders shows that it would be unlikely for the riders to obtain this. The recovery levels varied from 100 to 200 watts.
But, in this example, the introduction of a third similar rider would enable the recovery period to be longer, perhaps two minutes and therefore allow each rider would be able to recover at 54 watts below their FTP (179 watts), which looks more realistic.
Thus, the power meter has enabled us to assess figures from previous performances and use a rough hypothesis to balance the energy debt with the energy recovery for the purposes of planning a team event. Having made the initial plan, it is then time to practice in the real world – with each rider staying on the front for his or her allotted time and effort – and then evaluate what happens.
Photo 1 courtesy of Shutterstock.


