Whenever weightlifters gather, they always compare performances, as you might expect. Everyone wants to know where he or she falls in the sport hierarchy. Since weightlifting is a sport of numbers, it is easy to see where we stand in our various bodyweight categories. But the discussion gets more heated when we start talking about who is the best “pound for pound” (P4P).
The Debate
This problem also surfaces in the combat sports, especially in boxing. Whenever Sugar Ray Robinson’s name is mentioned, invariably somebody will add that he was “pound for pound the greatest.” While not all agree with that assessment, they would all agree it is unfair to compare Robinson’s skills against much bigger fighters on an absolute basis.
It is obvious that a smaller, but far superior fighter could still lose to a less-skilled bigger man. For that reason, many boxing magazines now publish monthly “P4P” ratings along with their usual bodyweight class rankings. As you might guess, there is considerable debate over the lists, but that is what makes it interesting.
What Is Fair?
Smaller lifters are definitely much better on a P4P basis. This has led some to conclude that they are even morally superior to their larger teammates whose pound-for-pound performances make them appear lazy and pampered in comparison. The lighter athletes, in these cases, would prefer that the only formula needed to compare performances is one where the performance is simply divided by the bodyweight.
“Strength-to-bodyweight potential is not a straight-line arithmetic progression.”
It will soon be pointed out that such a comparison is inherently unfair. Strength-to-bodyweight potential is not a straight-line arithmetic progression. Instead, it is a logarithmic one based upon exponential growth using a power of ⅔. This is because the cross-sectional area of the muscle increases to the power of two while the volume of that muscle increases to the power of three.
Note: I will not go into this further here since it is well documented in many places elsewhere. You’re going to have to take my word for it. But the weight sports have developed formulae based on such bio-mathematical concepts. The Sinclair Formula is used in weightlifting while the Wilks Formula prevails in powerlifting.
The History and the Math
Weightlifting has the advantage over boxing in that its performances are purely numeric. Back in the 1930s, Bob Hoffman, owner of the York Barbell Company, developed the Hoffman Formula, which attempted to neutralize the bodyweight issue when comparing performances. This worked reasonably well for a number of decades until it was generally agreed that the formula was increasingly favoring the heavier athletes. This was at least partly explained by the fact the heavier weight categories improved much faster than the lighter ones and consequently ended up with better scores. An attempt was made at correcting the Hoffman formula, but this only held sway for a few years until Dr. Roy Sinclair developed his and was able to get it recognized by the International Weightlifting Federation.

With the passing of Dr. Sinclair, there has been some renewed discussion about the various formulae. Sinclair developed his back in 1978, deriving it from the performances of top-level weightlifters so that top performances could be displayed graphically. At all points along the resulting curve there is a corresponding coefficient for each bodyweight. This coefficient is then simply multiplied by the lifter’s total in order to get his “Sinclair total.”
What that figure gives you is essentially what that lifter would have totaled if that lifter was a super heavyweight. The formula was normalized at a high bodyweight under the assumption that most lifters would like to know what they would lift if they were bigger – not smaller as Hoffman’s had done. This formula is updated every Olympiad in order to stay current. In this way, the performance of a 60kg athlete can be readily compared with the performance of a 100kg athlete. Whoever has the highest Sinclair total would be adjudged the better P4P lifter.
Wilks vs. Sinclair
Powerlifting also used the Hoffman in its early years, but also came to recognize its shortcomings. Several different formulas were arrived at over the years, until we now have the Wilks Formula. This formula appears to be much different from the Sinclair model if you merely look at its coefficients. This has prompted some to wonder why they are so different.
Some try to answer this question by assuming that since the nature of the lifts, their number, and manner of lifting are so much different, that it is only reasonable that a far different formula would be required. Although I have only a sketchy knowledge of mathematics and statistics, I was sure that these assumptions are not warranted.
“This may well be true since in the sport of powerlifting the three lifts are not as well correlated as they are in the Olympic lifts.”
To determine if I was right, I decided to compare the coefficients used by both. Each formula started with high coefficients at the lighter bodyweights and decrease toward the heavier end. This only stands to reason as the smaller lifters will need a bigger coefficient to equalize performances.
The main problem encountered with this method is that each set of coefficients was normalized at differing body weights. Sinclair normalized his at the super heavyweight level since, as mentioned, lifters typically like to see how they would do if they were larger. The Wilks, by contrast, is normalized down at the 51kg level. His formula answers the question, “What would I total if I weighed 51kg?” Now do you see the problem?

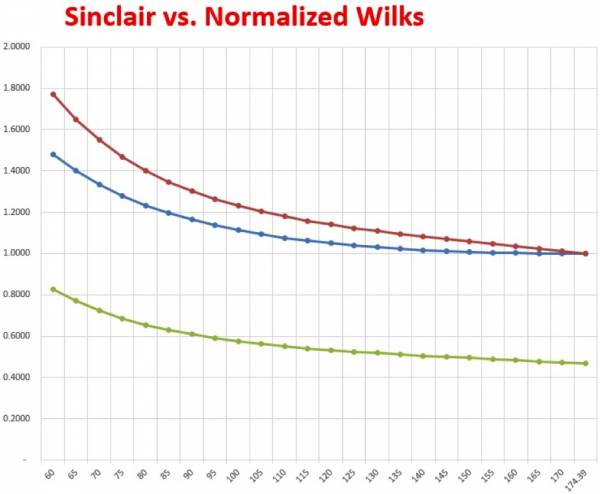
In order to correct this, I renormalized the Wilks figures by simply dividing each one of them by the Wilks coefficients of the same bodyweight as Sinclair’s model. Since they all divided by the same figure, it does not change the general nature of the curve. Therefore the two formulae can be more readily compared. The following is a graphical interpretation of the results.
- The red line at the top is the Sinclair curve.
- The green line at the bottom is the raw Wilks curve.
- The blue line in the middle is the normalized Wilks curve.
- The X-axis numbers are the body weights.
- The Y-axis numbers are the coefficients.

From this, it can be easily seen that the graphs of the Sinclair and renormalized Wilks numbers are very similar. The Sinclair has a steeper curve than the Wilks, so the next question has to be “why?” I cannot give an easy answer to this, but others have tried.
The Fault of Correlation
Wilks based his formula on the totals results of world championships, just as Sinclair did. Some have reasoned that if a separate formula existed for each of the individual lifts that their curves would be a little steeper. This may well be true since in the sport of powerlifting the three lifts are not as well correlated as they are in the Olympic lifts. In the latter the snatch is usually about 80% of the clean and jerk, give or take only small variances. The snatch and the clean are very similar movements and differ only in the height to which they must be lifted. Therefore, one is easily predictable if the other is known.
“What both demonstrate is that the P4P ratio is not fixed, neither is it arithmetic. It is logarithmic – whether we like it or not.”
The powerlifts are not so well correlated. Most lifters deadlift more than they squat, but not all of them do. Powerlifting has more specialists on individual lifts due to the fact that the type of body that makes for a good bench presser does not make for a good deadlifter. It frequently happens that bench and deadlift record holders do not do so well in the total. Those who do better in the total are more well-rounded lifters. This tends to flatten out their totals compared to what the three individual record lifts would add up to.
The Whole P4P
While I am not sure all this is the reason for the slight differences in the formulas, I think what is more important is their similarities. They are not vastly different as some people assume them to be just because their coefficients appear so. Their underlying premises are the same – strength potential as one increases in size is a logarithmic function not an arithmetic one.
What both demonstrate is that the P4P ratio is not fixed, neither is it arithmetic. It is logarithmic – whether we like it or not.
You’ll also enjoy:
- Strong Is as Strong Does: Your Ideal Weightlifting Weight
- Cutting Weight in Weightlifting: Is There a Better Way?
- Lose Weight, Not Bone: How Strength Training Benefits Weightloss
- What’s New On Breaking Muscle Today
Photos courtesy of Shutterstock.


